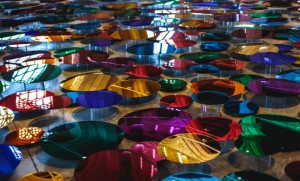
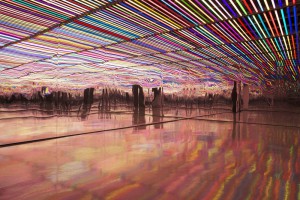
We started this project by choosing a color and trying to find a match in our surroundings. And instead of searching for the solid color objects have, I started to look at the colors that were reflected in certain objects and how the colors change in the shadow. So when we were asked to make a color system I started thinking about working with reflecting colors. But after researching the CIE-1931-system and reading about all the other really mathematical systems I got a little bit confused.
A color system was now in my head something that was very structured, had a mathematical origin, even and could be presented in graphs. So when I was working with the reflection of color I soon got stuck on trying to systematize this. First, I did some visual research on the different ways materials reflect color. I did this so I could maybe make my own objects which would reflect the color. But I didn’t see how to make this into a system. I thought maybe using different gradients and different materials to get various color reflections, but I didn’t really think this was a real system.
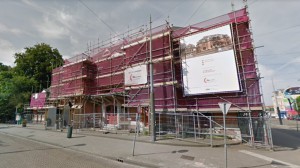
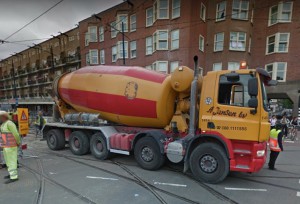
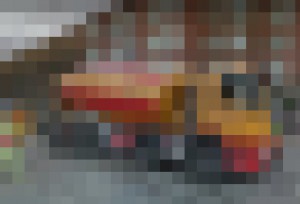
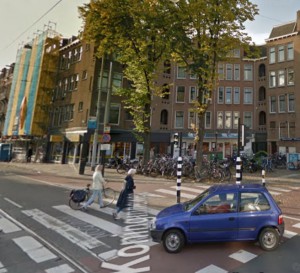
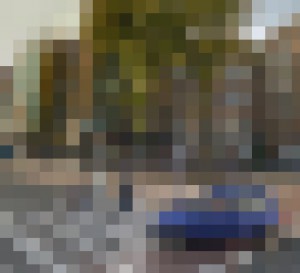
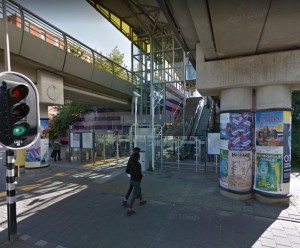
This is the moment when I got really stuck. First, I just tried to research a lot of different color systems and came up with a few ideas, but never really worked them out. So when I was talking with a classmate about his color system I mentioned the idea of using google maps to get an overview and then I thought why don’t I use google maps for my color system, because for the first time I had the feeling I could approach this in a systematic way. There was already a lot given in Google Maps, almost everything is already visualized and there’s also already some sort of system, countries are divided by regions and cities by neighborhoods and so on. So I could make a color system out of this. Maybe measuring the green in different capitals, by taking screensavers of google maps and pixelate the capitals in color graphs and look at the graduation of the green. So I opened google maps, and Photoshop and started to take some screensavers and pixelating them.
But when I was working with this, it felt so easy to just make a graph of the green in capitals and only making a screen shot and pixelating it. So now when I made screenshots in google maps and edited them in Photoshop I slowly started to let go of the idea that it had to be confined in this systematic approach.
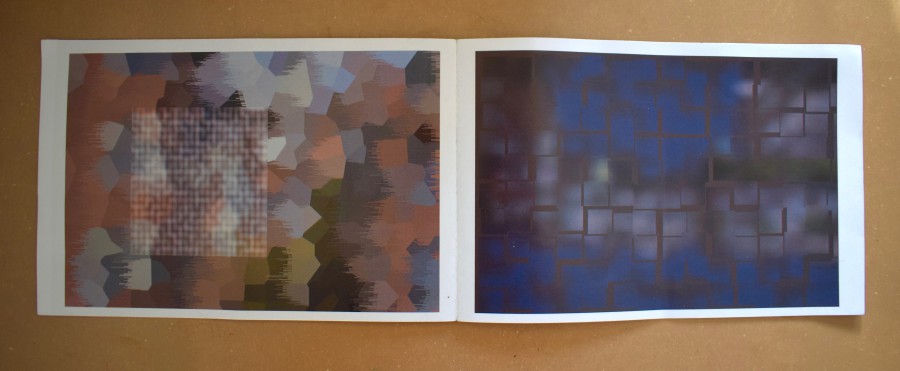
This was I think the first time there was some freedom for me in the assignment. So I just played around with the pictures, editing them in Photoshop.Although I still felt that what came out didn’t really made sense, I tried to ignore this feeling for a while and just see what happened. What came out of editing these photo’s more freely were all kinds of camouflages of the city. For the first time in the project I gave myself the space to explore what will happen in the making and this at least created something to react to. Now I had these pictures, I had to find a way to bring them together in a next step. The most obvious way to do this is to make a booklet and this is what I did.
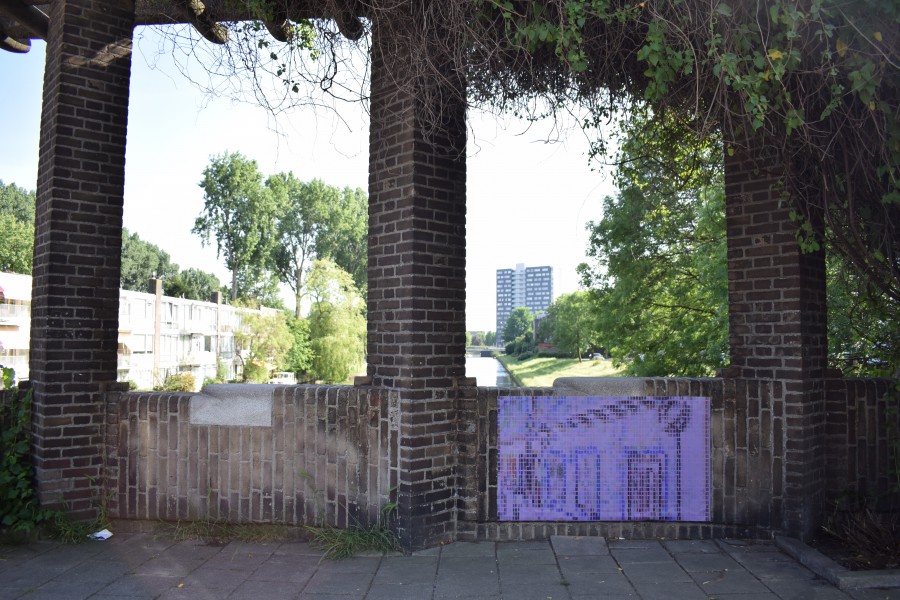
But I knew this wasn’t the best way to present it. Not only because it was a badly published booklet, but the pictures also needed something extra to make them work. Now they’re just plain pictures in a book without getting a clear notion of what they represent. I had a talk with Matthias and we both agreed that maybe the best format for this is to bring it back into the city, to give the pictures a context. So what I’m now going to do is making posters and put them up in the city and photograph them.
In the end, I think I learned that I should have given myself the freedom to let go of this rigid idea of a system and to try out things earlier. Because when I did this it became more fun to do and there was also more room for other possibilities.
